Confusion Matrix In Multiclass Classification
May 24, 2019
多分类问题中的混淆矩阵
import numpy as np
import matplotlib.pyplot as plt
from sklearn import datasets
digits = datasets.load_digits()
X = digits.data
y = digits.target
from sklearn.model_selection import train_test_split

X_train, X_test, y_train, y_test = train_test_split(X, y, random_state=666, test_size=0.8)
from sklearn.linear_model import LogisticRegression

log_reg = LogisticRegression()
log_reg.fit(X_train, y_train)
log_reg.score(X_test, y_test)
0.93115438108484
y_predict = log_reg.predict(X_test)
from sklearn.metrics import precision_score

precision_score(y_test, y_predict, average="micro")
0.93115438108484
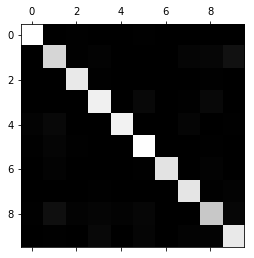
from sklearn.metrics import confusion_matrix

cfm = confusion_matrix(y_test, y_predict)
cfm
array([[147,   0,   1,   0,   0,   1,   0,   0,   0,   0],
       [  0, 123,   1,   2,   0,   0,   0,   3,   4,  10],
       [  0,   0, 134,   1,   0,   0,   0,   0,   1,   0],
       [  0,   0,   0, 138,   0,   5,   0,   1,   5,   0],
       [  2,   5,   0,   0, 139,   0,   0,   3,   0,   1],
       [  1,   3,   1,   0,   0, 146,   0,   0,   1,   0],
       [  0,   2,   0,   0,   0,   1, 131,   0,   2,   0],
       [  0,   0,   0,   1,   0,   0,   0, 132,   1,   2],
       [  1,   9,   2,   3,   2,   4,   0,   0, 115,   4],
       [  0,   1,   0,   5,   0,   3,   0,   2,   2, 134]], dtype=int64)
plt.matshow(cfm, cmap=plt.cm.gray)
plt.show()
对矩阵做处理,突出错误
# 每行求和
row_sums = np.sum(cfm, axis=1)
# 求出每个格子占本行比例
err_matrix = cfm / row_sums
# 对角线置0
np.fill_diagonal(err_matrix, 0)
err_matrix
array([[0.        , 0.        , 0.00735294, 0.        , 0.        ,
        0.00657895, 0.        , 0.        , 0.        , 0.        ],
       [0.        , 0.        , 0.00735294, 0.01342282, 0.        ,
        0.        , 0.        , 0.02205882, 0.02857143, 0.06802721],
       [0.        , 0.        , 0.        , 0.00671141, 0.        ,
        0.        , 0.        , 0.        , 0.00714286, 0.        ],
       [0.        , 0.        , 0.        , 0.        , 0.        ,
        0.03289474, 0.        , 0.00735294, 0.03571429, 0.        ],
       [0.01342282, 0.03496503, 0.        , 0.        , 0.        ,
        0.        , 0.        , 0.02205882, 0.        , 0.00680272],
       [0.00671141, 0.02097902, 0.00735294, 0.        , 0.        ,
        0.        , 0.        , 0.        , 0.00714286, 0.        ],
       [0.        , 0.01398601, 0.        , 0.        , 0.        ,
        0.00657895, 0.        , 0.        , 0.01428571, 0.        ],
       [0.        , 0.        , 0.        , 0.00671141, 0.        ,
        0.        , 0.        , 0.        , 0.00714286, 0.01360544],
       [0.00671141, 0.06293706, 0.01470588, 0.02013423, 0.01333333,
        0.02631579, 0.        , 0.        , 0.        , 0.02721088],
       [0.        , 0.00699301, 0.        , 0.03355705, 0.        ,
        0.01973684, 0.        , 0.01470588, 0.01428571, 0.        ]])
plt.matshow(err_matrix, cmap=plt.cm.gray)
plt.show()
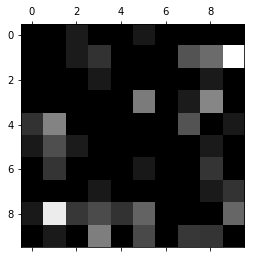
可以看出许多8被预测为1,很多1被预测为9,我们可以相应的做优化,可以分解为两个二分类问题,通过调节1和8,1和9之间的阈值来优化
有些时候也可能是样本的问题,我们不能通过算法解决这个问题,这时候我们要回到数据中