Introduction Of Decisiontree
May 31, 2019
决策树
决策树在生活中十分常用
比如:
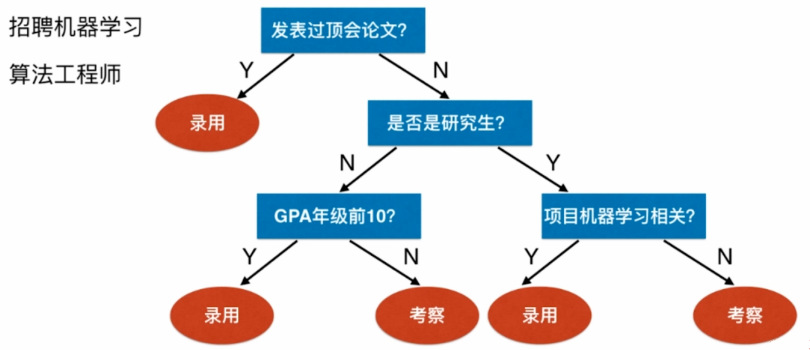
上述过程就是一个决策树
它拥有数据结构中树型结构的特点,包括深度、节点等
import numpy as np
import matplotlib.pyplot as plt
from sklearn import datasets
iris = datasets.load_iris()
X = iris.data[:,2:]
y = iris.target
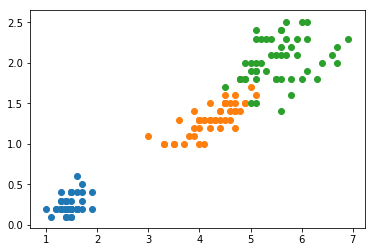
plt.scatter(X[y==0, 0], X[y==0, 1])
plt.scatter(X[y==1, 0], X[y==1, 1])
plt.scatter(X[y==2, 0], X[y==2, 1])
plt.show()
from sklearn.tree import DecisionTreeClassifier
dt_clf = DecisionTreeClassifier(max_depth=2, criterion="entropy", random_state=42)
dt_clf.fit(X, y)
DecisionTreeClassifier(class_weight=None, criterion=’entropy’, max_depth=2, max_features=None, max_leaf_nodes=None, min_impurity_decrease=0.0, min_impurity_split=None, min_samples_leaf=1, min_samples_split=2, min_weight_fraction_leaf=0.0, presort=False, random_state=42, splitter=’best’)
def plot_decision_boundary(model, axis):

    x0, x1 = np.meshgrid(
        np.linspace(axis[0], axis[1], int((axis[1]-axis[0])*100)).reshape(-1, 1),
        np.linspace(axis[2], axis[3], int((axis[3]-axis[2])*100)).reshape(-1, 1),
    )
    X_new = np.c_[x0.ravel(), x1.ravel()]

    y_predict = model.predict(X_new)
    zz = y_predict.reshape(x0.shape)

    from matplotlib.colors import ListedColormap
    custom_cmap = ListedColormap(['#EF9A9A','#FFF59D','#90CAF9'])

    plt.contourf(x0, x1, zz, cmap=custom_cmap)
plot_decision_boundary(dt_clf, axis=[0.5, 7.5, 0, 3])
plt.scatter(X[y==0, 0], X[y==0, 1])
plt.scatter(X[y==1, 0], X[y==1, 1])
plt.scatter(X[y==2, 0], X[y==2, 1])
plt.show()
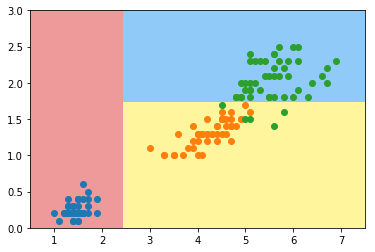
上图就是决策树的决策边界
我们估算出这个决策树是
x1 < 2.1 ? a : (x2 < 1.8 ? b : c)
特点
- 非参数学习算法
- 可以解决分类问题
- 天然的可以解决多分类问题
- 可以解决回归问题
- 具有非常好的可解释性
问题
- 每个节点在哪个维度做划分
- 某个维度在哪个值上做划分