Learning Curve
April 23, 2019
学习曲线
随着训练样本的逐渐增多,算法训练出的模型的表现能力。
import numpy as np
import matplotlib.pyplot as plt
np.random.seed(666)
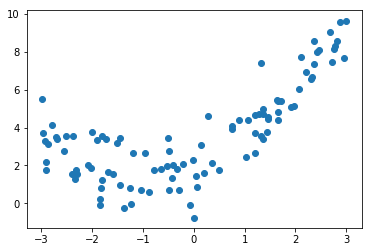
x = np.random.uniform(-3.0, 3.0, size=100)
X = x.reshape(-1, 1)
y = 0.5 * x**2 + x + 2 + np.random.normal(0, 1, size=100)
plt.scatter(x, y)
plt.show()
学习曲线是什么
from sklearn.model_selection import train_test_split

X_train, X_test, y_train, y_test = train_test_split(X, y, random_state=10)
封装绘制学习曲线函数和多项式回归函数
from sklearn.linear_model import LinearRegression
from sklearn.metrics import mean_squared_error

def plot_learning_curve(algo, X_train, X_test, y_train, y_test, axis_x=None, axis_y=None):
    train_score = []
    test_score = []
    for i in range(1, X_train.shape[0] + 1):

        algo.fit(X_train[:i], y_train[:i])

        y_predict_train = algo.predict(X_train[:i])
        train_score.append(mean_squared_error(y_train[:i], y_predict_train))

        y_predict_test = algo.predict(X_test)
        test_score.append(mean_squared_error(y_test, y_predict_test))

    plt.plot([i for i in range(1, X_train.shape[0] + 1)], np.sqrt(train_score), label='train')
    plt.plot([i for i in range(1, X_train.shape[0] + 1)], np.sqrt(test_score), label='test')
    plt.legend()
    if axis_x is not None and axis_y is not None:
        plt.axis([0, axis_x, 0, axis_y])
    plt.show()
from sklearn.preprocessing import PolynomialFeatures
from sklearn.preprocessing import StandardScaler
from sklearn.pipeline import Pipeline

def PolynomialRegression(degree):
    return Pipeline([
        ("poly", PolynomialFeatures(degree=degree)),
        ("std_scaler", StandardScaler()),
        ("lin_reg", LinearRegression())
    ])
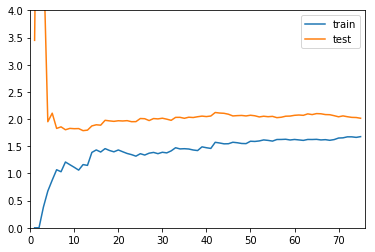
线性回归
plot_learning_curve(LinearRegression()
                    , X_train, X_test, y_train, y_test, len(X_train)+1, 4)
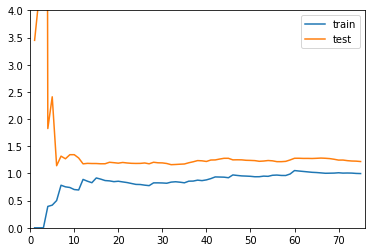
多项式回归
plot_learning_curve(PolynomialRegression(2)
                    , X_train, X_test, y_train, y_test, len(X_train)+1, 4)
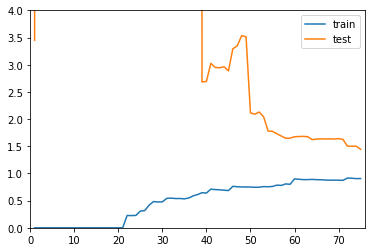
plot_learning_curve(PolynomialRegression(20)
                    , X_train, X_test, y_train, y_test, len(X_train)+1, 4)
总结
以上三张图分别代表欠拟合、刚好、过拟合的三种情况:
- 欠拟合和刚好相比,无论训练还是测试数据集,均方根误差都更大
- 过拟合和刚好相比,在训练数据集上,误差不大,问题在于测试数据集误差比较大,而且和训练数据集误差差距比较大,说明泛化能力差