Rbf Kernel
May 29, 2019
什么是核函数
SVM本质是一个最优化问题,我们需要把它转化为一个更好解的形式
由
\[min\frac{1}{2}||w||^2 + C \sum_{i=1}^m \zeta_i\] \[s.t. \quad y^{(i)}(w^Tx^{(i)} + b) \geq 1 - \zeta_i \qquad \zeta_i \geq 0\]转换为
\[max\sum_{i=1}^m\alpha_i - \frac{1}{2}\sum_{i=1}^m\sum_{j=1}^m \alpha_i \alpha_j y_i y_j x_i x_j\] \[s.t. \quad 0 \leq \alpha_i \leq C \qquad \sum_{i=1}^m \alpha_i y_i = 0\]核函数
对于使用新的特征(比方说多项式),我们之前都是先将式子中的特征$x_i$和$x_j$变换为新特征$x_i^{‘}$和$x_j^{‘}$,然后进行运算
如果不先分别处理式子中$x_i$和$x_j$,然后进行运算,而是直接有一个函数$K(x_i, x_j) = x_i^{‘}x_j^{‘}$
\[max\sum_{i=1}^m\alpha_i - \frac{1}{2}\sum_{i=1}^m\sum_{j=1}^m \alpha_i \alpha_j y_i y_j K(x_i, x_j)\] \[s.t. \quad 0 \leq \alpha_i \leq C \qquad \sum_{i=1}^m \alpha_i y_i = 0\]那我们称$K(x_i, x_j)$为核函数
优点:
- 减少了计算量
- 减少了存储空间
多项式核函数
二次
\[K(x, y) = (x \cdot y + 1)^2\]如果不使用核函数
\[K(x, y) = (\sum_{i=1}^m x_i y_i + 1)^2\] \[K(x, y) = \sum_{i=1}^n(x_i^2)(y_i^2) + \sum_{i=2}^n\sum_{j=1}^{i-1}(\sqrt 2 x_i x_j)(\sqrt 2 y_i y_j) + \sum_{i=1}^n(\sqrt 2 x_i)(\sqrt 2 y_i) + 1 = x^{'} \cdot y^{'}\] \[x^{'}=(x_n^2, \ldots, x_1^2, \sqrt 2 x_n x_{n-1}, \ldots, \sqrt 2 x_n, \dots, \sqrt 2 x_1, 1)\]$y^{‘}$也是,类似的形式,先计算出$x^{‘}$和$y^{‘}$,再运算点乘,很麻烦
多次
\[K(x, y) = (x \cdot y + c)^d\]线性核函数
\[K(x, y) = x \cdot y\]高斯核函数
使用很多,可以看做正态分布的一种表达方式
由高斯函数
\[g(x) = \frac{1}{\sigma \sqrt{2\pi}}e^{-\frac{1}{2}(\frac{\, x-\mu \;}{\sigma})^2}\]变化而来
高斯核函数
\[K(x, y) = e^{-\gamma ||x-y||^2}\]有时候也被成为 RBF核 Radial Basis Function Kernel(径向基函数核)
本质:升维,将每一个样本点映射到一个无穷维的特征空间
依靠升维可以使得原本线性不可分的数据线性可分
直观理解高斯核函数
import numpy as np
import matplotlib.pyplot as plt
x = np.arange(-4, 5, 1)
x
array([-4, -3, -2, -1, 0, 1, 2, 3, 4])
y = np.array((x >= -2) & (x <= 2), dtype=int)
y
array([0, 0, 1, 1, 1, 1, 1, 0, 0])
plt.scatter(x[y==0], [0] * len(x[y==0]))
plt.scatter(x[y==1], [0] * len(x[y==1]))
plt.show()
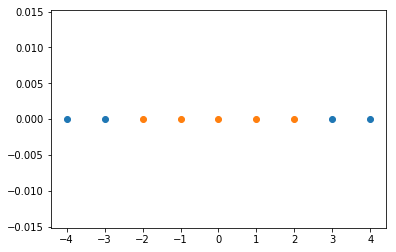
可以看到是个线性不可分的数据
def gaussian(x, l):
    gamma = 1.0
    return np.exp(-gamma * (x-l)**2)
l1,l2 = -1,1

X_new = np.empty((len(x), 2))
for i, data in enumerate(x):
    X_new[i, 0] = gaussian(data, l1)
    X_new[i, 1] = gaussian(data, l2)
plt.scatter(X_new[y==0,0], X_new[y==0,1])
plt.scatter(X_new[y==1,0], X_new[y==1,1])
plt.show()
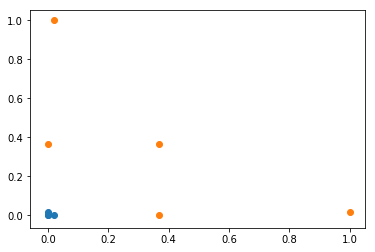
经过高斯核函数,变成线性可分的问题了
landmark
上述两个点l1, l2, 称为两个landmark
高斯核:对于每个数据点都是landmark
m * n 的数据映射称为 m * m 的数据
计算开销非常大,但是有些应用非常适合高斯核函数,比方说,初始维度很高,但是样本数不多,尤其是 n > m 的时候。比方说自然语言处理非常适合高斯核。
gamma
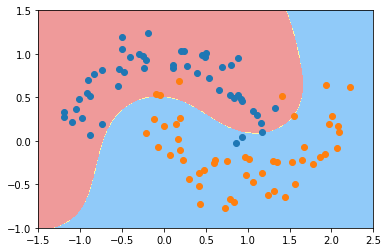
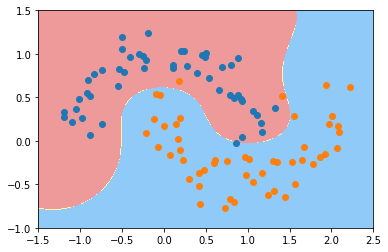
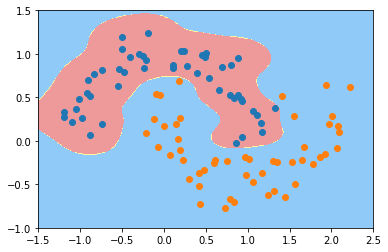
gamma越大,高斯分布越窄; gamma越小,高斯分布越宽。
scikit-learn 中的高斯核函数
from matplotlib.colors import ListedColormap

def plot_decision_boundary(model, axis):
    x0, x1 = np.meshgrid(
        np.linspace(axis[0], axis[1], int((axis[1] - axis[0]) * 100 )).reshape(-1, 1),
        np.linspace(axis[2], axis[3], int((axis[3] - axis[2]) * 100 )).reshape(-1, 1)
    )
    X_new = np.c_[x0.ravel(), x1.ravel()]

    y_predict = model.predict(X_new)
    zz = y_predict.reshape(x0.shape)

    custom_camp = ListedColormap(['#EF9A9A', '#FFF59F', '#90CAF9'])
    plt.contourf(x0, x1, zz, cmap=custom_camp)
from sklearn import datasets
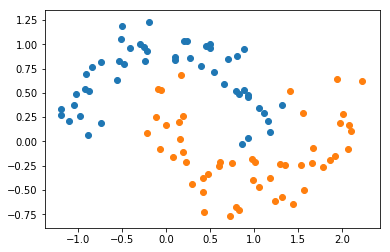
X, y = datasets.make_moons(noise=0.15, random_state=666)

plt.scatter(X[y==0,0], X[y==0,1])
plt.scatter(X[y==1,0], X[y==1,1])
plt.show()
from sklearn.preprocessing import StandardScaler
from sklearn.svm import SVC
from sklearn.pipeline import Pipeline
def RBFKerbelSVC(gamma=1.0):
    return Pipeline([
        ("std_scaler", StandardScaler()),
        ("svc", SVC(kernel="rbf", gamma=gamma))
    ])
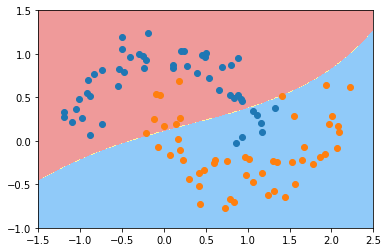
svc_gamma01 = RBFKerbelSVC(0.1)
svc_gamma01.fit(X, y)

plot_decision_boundary(svc_gamma01, [-1.5,2.5,-1,1.5])
plt.scatter(X[y==0,0], X[y==0,1])
plt.scatter(X[y==1,0], X[y==1,1])
plt.show()
svc_gamma05 = RBFKerbelSVC(0.5)
svc_gamma05.fit(X, y)

plot_decision_boundary(svc_gamma05, [-1.5,2.5,-1,1.5])
plt.scatter(X[y==0,0], X[y==0,1])
plt.scatter(X[y==1,0], X[y==1,1])
plt.show()
svc_gamma1 = RBFKerbelSVC(1)
svc_gamma1.fit(X, y)

plot_decision_boundary(svc_gamma1, [-1.5,2.5,-1,1.5])
plt.scatter(X[y==0,0], X[y==0,1])
plt.scatter(X[y==1,0], X[y==1,1])
plt.show()
svc_gamma10 = RBFKerbelSVC(10)
svc_gamma10.fit(X, y)

plot_decision_boundary(svc_gamma10, [-1.5,2.5,-1,1.5])
plt.scatter(X[y==0,0], X[y==0,1])
plt.scatter(X[y==1,0], X[y==1,1])
plt.show()
svc_gamma100 = RBFKerbelSVC(100)
svc_gamma100.fit(X, y)

plot_decision_boundary(svc_gamma100, [-1.5,2.5,-1,1.5])
plt.scatter(X[y==0,0], X[y==0,1])
plt.scatter(X[y==1,0], X[y==1,1])
plt.show()
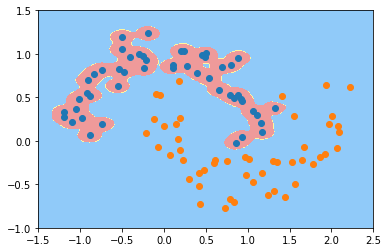
可以看到,gamma取值越大,模型越复杂,会导致过拟合,过小会导致欠拟合